
Climate science helps students understand how Earth’s atmosphere, oceans, land, and living systems interact. It also teaches them how to investigate complex questions, interpret scientific data, evaluate evidence, and make informed decisions about environmental challenges. Instead of learning climate concepts only from textbooks, students can develop a deeper understanding through experiments, data analysis, classroom models, and real-world investigations.
Effective climate science activities for students connect scientific principles with observable evidence. Learners can investigate how different surfaces absorb heat, analyze long-term temperature records, model the greenhouse effect, explore sea-level changes, and evaluate possible solutions to local environmental problems. These activities make abstract concepts easier to understand while strengthening critical thinking and scientific literacy.
Teachers can adapt climate science lessons for elementary, middle, and high school students by adjusting the complexity of the data, experiments, and explanations. The goal is not simply to memorize facts about climate change. It is to help students understand how scientists gather evidence, develop explanations, test ideas, and communicate conclusions responsibly.
Why Is Climate Science Important for Students?
Climate science education helps students understand the natural systems that influence Earth’s climate and the ways human activities affect those systems. It also develops transferable skills that students can use in science, mathematics, geography, technology, and everyday decision-making.
1. Develops Scientific Thinking
Students learn to distinguish observations from assumptions, recognize patterns, compare explanations, and support conclusions with evidence. These skills are valuable when evaluating scientific claims in news articles, online discussions, and other information sources.
2. Connects Science to Everyday Life
Climate science can explain why cities experience heat islands, how changing rainfall patterns affect agriculture, why glaciers and ice sheets matter, and how energy use influences greenhouse gas emissions. Connecting these concepts to familiar experiences helps students recognize the relevance of science.
3. Strengthens Data Literacy
Climate scientists work with temperature measurements, precipitation records, ocean observations, satellite images, and computer models. Students who analyze similar information gain practice reading graphs, identifying trends, comparing datasets, and understanding uncertainty.
4. Encourages Evidence-Based Problem-Solving
Climate-related challenges often require several kinds of knowledge. Students can investigate how trees provide shade, how buildings retain heat, or how communities prepare for flooding. They can then compare possible responses using scientific evidence and practical constraints.
5. Builds Environmental Awareness Without Creating Fear
Climate education should be scientifically accurate, age-appropriate, and constructive. Students need opportunities to understand environmental risks while exploring realistic responses, including energy efficiency, ecosystem protection, community adaptation, and responsible resource use.
12 Evidence-Based Climate Science Activities for Students
The following activities combine investigation, observation, data interpretation, and scientific reasoning. Teachers should encourage students to record what they observe, explain what the evidence supports, and identify the limitations of each experiment.
1. Investigate How Different Surfaces Absorb Heat
Main concept: Surface reflectivity, absorption, and local temperature differences.
Suitable for: Elementary and middle school students.
Students investigate why dark surfaces can become warmer in sunlight than lighter surfaces under similar conditions.
Materials:
- Two identical shallow trays or sheets of cardboard
- One dark-colored and one light-colored surface
- Two thermometers or temperature probes
- A timer
- A notebook for recording measurements
- A sunny location or a suitable classroom lamp
Procedure:
- Place the dark and light surfaces side by side.
- Measure and record their starting temperatures.
- Expose both surfaces to the same light source for equal periods.
- Record their temperatures at regular intervals, such as every two minutes.
- Create a line graph comparing the temperature changes.
- Discuss why the surfaces warmed differently.
Questions for students:
- Which surface warmed more quickly?
- Were the starting temperatures the same?
- What factors might affect the results?
- How could surface color influence temperatures in a neighborhood?
Scientific explanation: Different surfaces absorb and reflect incoming energy differently. Dark surfaces often absorb more visible light than light surfaces, although material, texture, moisture, and other conditions also influence heating.
This experiment introduces the concept of albedo, which describes how much incoming radiation a surface reflects. Students can connect their results to urban heat islands, where pavement and buildings can contribute to elevated local temperatures.
Important limitation: A classroom surface experiment does not measure global warming. It demonstrates one process that can influence local heating and Earth’s energy balance.
2. Model the Greenhouse Effect
Main concept: How greenhouse gases influence Earth’s energy balance.
Suitable for: Middle and high school students.
The greenhouse effect is a central concept in climate science, but it can be difficult to visualize because greenhouse gases cannot be seen directly. A classroom model helps students investigate how different conditions influence temperature.
Materials:
- Two identical transparent containers
- Two thermometers or temperature probes
- A lamp that produces heat, or a suitable sunny location
- A timer
- A data table
Procedure:
- Place one thermometer inside each container.
- Keep both containers under the same light source and record their starting temperatures.
- Ensure the containers have comparable shapes, exposure, and starting conditions.
- Record temperatures at regular intervals.
- Compare the results and identify possible sources of experimental error.
- Ask students to explain what the model can and cannot demonstrate.
A more advanced investigation can compare air containing different concentrations of carbon dioxide using a teacher-designed protocol and appropriate equipment. Students should not generate or handle gases without suitable supervision and safety procedures.
Scientific explanation: Greenhouse gases absorb and emit infrared radiation, influencing how efficiently Earth loses energy to space. Human activities, especially fossil fuel combustion and land-use changes, have increased atmospheric greenhouse gas concentrations and strengthened this warming influence.
A critical teaching point: A transparent container can trap heat for reasons that differ from the atmospheric greenhouse effect, including reduced air circulation. Therefore, this activity should be presented as a simplified model of energy transfer, not definitive proof of the atmospheric mechanism.
Students should compare their observations with scientific explanations and independent evidence from atmospheric measurements.
3. Analyze Long-Term Temperature Records
Main concept: Climate trends, averages, variability, and evidence.
Suitable for: Middle and high school students.
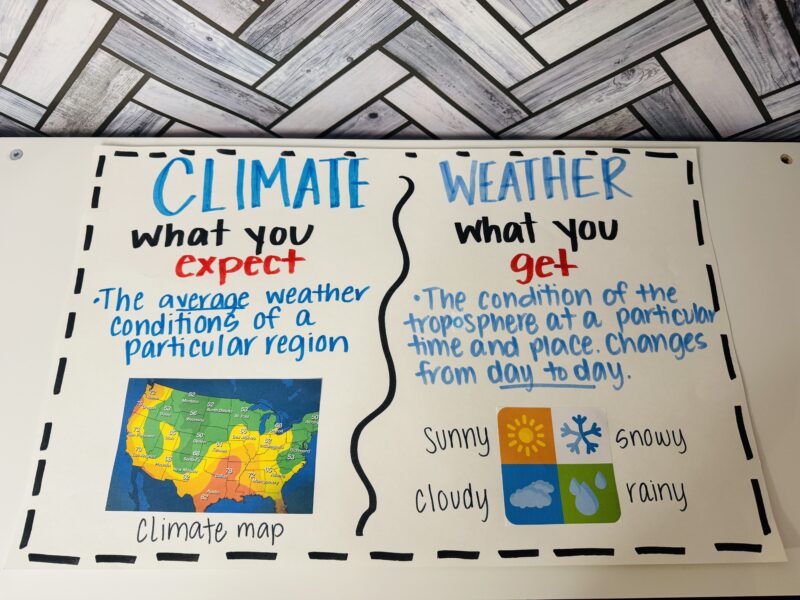
Weather can change from day to day, while climate describes patterns and statistics over longer periods. Analyzing temperature records helps students understand the difference.
Materials:
- A temperature dataset covering multiple years or decades
- Graph paper or spreadsheet software
- A calculator
- A worksheet with analysis questions
Procedure:
- Provide students with a verified temperature dataset from a reputable scientific source.
- Ask them to identify the time period, units, geographic coverage, and measurement method.
- Create a graph showing temperature changes over time.
- Calculate averages for selected periods if the dataset allows it.
- Identify long-term patterns and short-term fluctuations.
- Compare observations with the conclusions of scientific assessments.
Questions for students:
- What changes appear over the full period?
- Are there individual years that differ from the general pattern?
- Why should scientists examine long-term records rather than one day’s temperature?
- What additional evidence could strengthen the interpretation?
Scientific explanation: Individual years can be warmer or cooler than neighboring years because of natural variability. Long-term observations help scientists identify broader changes that cannot be understood from isolated weather events.
Students should also learn that the strongest conclusions about climate change come from multiple independent lines of evidence, including surface temperatures, ocean heat content, glacier changes, and satellite observations.
4. Explore the Difference Between Weather and Climate
Main concept: Short-term atmospheric conditions versus long-term patterns.
Suitable for: Elementary and middle school students.
This activity helps students avoid a common misconception: that a cold day disproves global warming.
Procedure:
- Ask students to describe the weather they experienced during the previous week.
- Have them identify variables such as temperature, rainfall, wind, and cloud cover.
- Provide a separate dataset showing long-term regional or global climate patterns.
- Ask students to compare the timescales represented by the two sets of information.
- Have students write a short explanation of why a single day’s weather cannot establish a climate trend.
Extension activity: Students can keep a daily weather journal for two weeks and compare it with a long-term climate summary for their region.
Scientific explanation: Weather refers to atmospheric conditions over relatively short periods. Climate describes long-term patterns, averages, ranges, and variations. A short classroom observation can describe local weather but cannot establish a long-term climate trend by itself.
This activity develops an essential foundation for interpreting climate data responsibly.
5. Investigate Melting Land Ice and Sea-Level Rise
Main concept: The difference between melting land ice and floating sea ice.
Suitable for: Middle and high school students.
Students often assume that all melting ice affects sea level in the same way. This investigation demonstrates why the location of ice matters.
Materials:
- Two transparent containers
- Water
- Ice cubes
- Small stones or a raised platform
- A ruler or marker
- A tray to catch spills
Procedure:
- Fill both containers with equal amounts of water and mark the starting levels.
- In the first container, float ice cubes in the water.
- In the second container, place ice cubes on a raised platform or stones so the meltwater flows into the container.
- Record the initial water levels.
- Allow the ice to melt completely.
- Compare the final levels and discuss the differences.
Scientific explanation: Melting floating ice generally has little direct effect on sea level because it already displaces water. In contrast, melting land ice adds water to the ocean and contributes to sea-level rise.
The classroom setup is a simplified model. Real sea-level change also depends on factors such as thermal expansion as ocean water warms, changes in land water storage, and the complex behavior of glaciers and ice sheets.
Discussion questions:
- Which setup represents floating sea ice?
- Which setup represents land ice melting into the ocean?
- What important real-world processes are missing from this model?
- Why should scientists distinguish between different sources of sea-level change?
6. Examine Ocean Warming and Thermal Expansion
Main concept: The relationship between water temperature and volume.
Suitable for: High school students.
The ocean absorbs much of the excess heat accumulating in Earth’s climate system. As seawater warms, it expands, contributing to global sea-level rise.
Materials:
- A transparent bottle or suitable flask
- Water
- A stopper fitted with a narrow transparent tube
- A thermometer
- Warm water prepared by the teacher
- A tray for spills
Procedure:
- Fill the container with water and fit the stopper and tube securely.
- Mark the starting water level in the tube.
- Place the container in a warm-water bath while keeping the apparatus stable.
- Observe any change in the water level as the water warms.
- Record the temperature and water-level observations.
- Discuss how this small-scale demonstration relates to ocean warming.
Scientific explanation: Water expands as its temperature increases over the range relevant to this demonstration. Across the enormous volume of the ocean, thermal expansion contributes to sea-level rise.
The classroom model shows the basic physical principle, but it does not reproduce the scale, salinity, pressure, or circulation of the real ocean.
Safety note: Use warm rather than boiling water, and have the teacher assemble or supervise the apparatus.
7. Investigate How Plants Influence Local Temperatures
Main concept: Shade, evapotranspiration, and local climate adaptation.
Suitable for: Elementary through high school students.
Trees and other vegetation can cool some environments by providing shade and releasing water vapor through evapotranspiration. Students can investigate how vegetation influences temperatures in their school surroundings.
Materials:
- A thermometer or temperature probe
- A notebook
- A schoolyard map
- Optional soil-moisture measurements
Procedure:
- Identify several locations, such as an area under a tree, an open paved surface, and a grassy area.
- Measure temperatures at comparable times.
- Repeat observations on multiple days when possible.
- Record cloud cover, recent rainfall, wind, and the amount of shade.
- Plot the results and discuss possible explanations.
Scientific explanation: Vegetation can influence local temperatures through shade and evapotranspiration. Paved surfaces may absorb and store heat, contributing to urban heat islands.
How to improve reliability: Students should take repeated measurements, use consistent instruments, and avoid claiming that surface temperature alone represents air temperature. A shaded thermometer may read differently from one exposed directly to sunlight.
This activity connects climate science with urban planning, landscape design, and community adaptation.
8. Model the Carbon Cycle
Main concept: Carbon movement among the atmosphere, oceans, living things, and Earth’s surface.
Suitable for: Middle and high school students.
Carbon constantly moves through Earth’s systems. Students can model these movements to understand why the amount of carbon stored in the atmosphere matters.
Materials:
- Cards representing the atmosphere, plants, animals, soil, oceans, and fossil fuel reservoirs
- Counters or paper tokens representing carbon
- Arrows or string
- A worksheet for recording transfers
Procedure:
- Assign students different roles representing carbon reservoirs.
- Give each group a starting number of carbon tokens.
- Use cards to represent processes such as photosynthesis, respiration, decomposition, ocean exchange, and fossil fuel combustion.
- Have students transfer tokens according to each process.
- Record how the distribution of carbon changes.
- Repeat the activity while adding extra carbon transfers from fossil fuel combustion.
Scientific explanation: Carbon moves naturally between reservoirs, but human activities have added substantial amounts of carbon dioxide to the atmosphere by burning fossil fuels and changing land use. Natural sinks, including the ocean and terrestrial ecosystems, absorb some of these emissions, but they do not eliminate the overall human-caused increase in atmospheric carbon dioxide.
Assessment question: Why can the atmosphere accumulate carbon dioxide even though plants and oceans absorb some of it?
Students should use their model to explain the difference between carbon moving through a system and the net change in atmospheric carbon.
9. Investigate Local Rainfall and Flood Risk
Main concept: Precipitation, runoff, land cover, and climate adaptation.
Suitable for: Elementary through high school students.
Flood risk depends on several factors, including rainfall intensity, drainage, land surface, soil conditions, and development. This activity allows students to investigate how different surfaces influence runoff.
Materials:
- Two shallow trays
- Soil, grass, or other suitable natural materials
- A smooth, relatively impermeable surface
- Equal amounts of water
- Measuring cups
- Collection containers
Procedure:
- Prepare one tray with soil and vegetation where available.
- Prepare a second tray with a relatively impermeable surface.
- Tilt both trays at the same angle.
- Pour equal amounts of water over each surface at a consistent rate.
- Collect and compare the runoff.
- Record how much water leaves each tray and how quickly it flows.
Scientific explanation: Vegetated and permeable surfaces can allow more water to infiltrate or remain temporarily stored, while impermeable surfaces often increase rapid runoff. The results depend on soil type, slope, vegetation, saturation, and rainfall intensity.
Important distinction: This experiment demonstrates runoff mechanisms. It does not prove that climate change caused a particular flood. Determining how climate change affects flood risk requires evidence about rainfall patterns, local geography, infrastructure, and other contributing factors.
Students can extend the investigation by examining local rainfall records and proposing practical ways to reduce flood risk.
10. Evaluate Renewable and Nonrenewable Energy Choices
Main concept: Energy systems, emissions, and evidence-based decision-making.
Suitable for: Middle and high school students.
Students can compare different electricity sources by examining how they generate energy and what environmental considerations accompany them.
Procedure:
- Divide students into small research groups.
- Assign each group an energy source, such as coal, natural gas, solar, wind, or hydropower.
- Ask students to research electricity generation, lifecycle greenhouse gas emissions, reliability, costs, land requirements, and environmental effects.
- Require them to record the source and date of each important claim.
- Have groups present their findings in a comparison table.
- Ask the class to recommend an energy mix for a hypothetical community, explaining its reasoning and trade-offs.
Scientific explanation: Energy sources differ in their greenhouse gas emissions and other environmental impacts. Fossil fuels produce carbon dioxide when burned, while renewable technologies generally have much lower operational emissions. Their full environmental impacts also depend on construction, materials, land use, and other lifecycle factors.
Students should avoid assuming that any energy source has zero environmental impact or that one solution works equally well in every location.
This activity strengthens research, quantitative reasoning, and respectful evidence-based discussion.
11. Analyze Climate Graphs and Satellite Images
Main concept: Interpreting scientific observations from different sources.
Suitable for: Middle and high school students.
Climate scientists use a variety of observations to study changes in Earth’s systems. Graphs and satellite images allow students to examine those changes without requiring specialized laboratory equipment.
Procedure:
- Select a scientific dataset or satellite image from a reliable educational or scientific source.
- Explain what is being measured, the units used, and the geographic area shown.
- Ask students to identify visible patterns and changes.
- Have them distinguish direct observations from interpretations.
- Ask what additional information would help test their explanation.
- Require students to write a short conclusion supported by specific evidence.
Possible subjects include glacier retreat, sea-ice extent, land-cover changes, temperature anomalies, and seasonal vegetation patterns.
Scientific thinking prompts:
- What does the graph or image actually measure?
- What pattern can be observed?
- What conclusion is supported by the available evidence?
- What uncertainties or limitations should be considered?
- Could another dataset help confirm the interpretation?
Teachers should explain that satellite images may show changes over time but do not always reveal their causes by themselves. Scientific conclusions often require several kinds of evidence.
12. Design a Climate-Resilient School
Main concept: Applying climate science and engineering to a real-world problem.
Suitable for: Elementary, middle, and high school students.
This project asks students to use scientific knowledge to propose practical improvements to their school environment.
Procedure:
- Ask students to identify an environmental challenge, such as excessive classroom heat, water waste, limited shade, or poor stormwater drainage.
- Gather observations, measurements, and relevant local information.
- Identify the people and school facilities affected by the problem.
- Develop two or more possible solutions.
- Compare the solutions using cost, feasibility, safety, expected benefits, and potential disadvantages.
- Create a diagram, model, poster, or short presentation.
- Invite students to explain what evidence supports their preferred design.
Possible proposals include planting appropriate shade trees, improving ventilation, adding reflective roofing where suitable, collecting rainwater where permitted, reducing unnecessary energy use, or improving drainage.
Students should distinguish between climate mitigation, which reduces greenhouse gas emissions or increases carbon removal, and climate adaptation, which reduces harm from climate impacts.
A school shading project, for example, is primarily an adaptation measure. A project that reduces electricity consumption and associated fossil fuel emissions can contribute to mitigation.
How to Teach Climate Science Through Evidence-Based Inquiry
The activities become more effective when students follow a consistent process for investigating scientific questions. Teachers can use the following sequence for experiments, data analysis, and project-based learning.
Step 1: Begin With a Testable Question
A focused question gives students a clear purpose. For example, instead of asking, “Is climate change real?” a teacher might ask, “What patterns appear in this 50-year temperature record, and what can the data tell us?”
The question should be suitable for the available evidence and the students’ age group.
Step 2: Identify Existing Knowledge and Misconceptions
Ask students what they already know about weather, climate, greenhouse gases, and energy. Use short written responses, concept maps, or class discussions to identify misunderstandings.
Common misconceptions include believing that weather and climate mean the same thing, assuming the greenhouse effect is inherently harmful, or thinking that one cold winter disproves long-term warming.
Step 3: Make a Prediction
Students should state what they expect to observe and explain why. Predictions help them connect prior knowledge with the investigation.
For example, students might predict that an exposed paved surface will become warmer than a shaded grassy surface during a sunny afternoon. They should also identify conditions that could affect the result.
Step 4: Collect Reliable Evidence
Students can collect their own measurements or work with established scientific datasets. They should record measurement methods, dates, units, instruments, and relevant conditions.
When using online information, teachers should encourage students to examine the publisher, the original dataset, the methods, and the date of publication.
Step 5: Analyze Results
Students can create tables, graphs, diagrams, or simple calculations to identify patterns. They should distinguish between a measurement and an interpretation of that measurement.
If results do not match a prediction, students should investigate possible explanations rather than altering the evidence to fit their expectations.
Step 6: Compare Evidence With Scientific Explanations
Classroom experiments are simplified. Students should compare their observations with established scientific explanations and recognize what their models leave out.
For instance, a lamp experiment can demonstrate changes in heating under different conditions, but it cannot reproduce the entire climate system.
Step 7: Communicate a Supported Conclusion
Ask students to explain what they investigated, what evidence they collected, what the evidence suggests, and what limitations remain.
A useful structure is:
- Claim: What conclusion are you proposing?
- Evidence: Which observations or measurements support it?
- Reasoning: How does scientific knowledge explain the connection between the evidence and the claim?
This approach helps students develop clear scientific arguments rather than simply repeating information from a textbook.
Sample One-Week Climate Science Lesson Plan
Teachers can organize climate science activities into a five-day learning sequence. The following example is designed for middle school but can be adapted for younger or older students.
| Day | Learning focus | Classroom activity | Evidence of learning |
|---|---|---|---|
| Day 1 | Weather and climate | Compare daily weather observations with long-term climate data | Students explain the difference between weather and climate |
| Day 2 | Earth’s energy balance | Investigate heating of different surfaces | Students record measurements and identify patterns |
| Day 3 | Climate evidence | Analyze a long-term temperature graph | Students interpret trends and variability |
| Day 4 | Climate impacts | Investigate runoff, vegetation, or sea-level models | Students explain a mechanism using evidence |
| Day 5 | Solutions and communication | Design a climate-resilient school improvement | Students present a proposal supported by evidence |
At the end of the week, students can complete a short reflection describing one concept they understand better, one piece of evidence that changed or strengthened their understanding, and one question they would like to investigate next.
Adapting Climate Science Activities for Different Grade Levels
Climate science activities should match students’ developmental levels and prior knowledge. The central scientific idea can remain the same while the complexity of the investigation changes.
Elementary School
Focus on direct observations, simple comparisons, drawings, and guided questions.
Suitable activities include:
- Comparing temperatures in sunny and shaded locations.
- Keeping a weather journal.
- Modeling carbon movement with cards.
- Observing how plants provide shade.
- Building simple models of runoff.
Students should learn basic vocabulary and explain observations in their own words.
Middle School
Introduce data tables, line graphs, controlled investigations, and more detailed explanations.
Suitable activities include:
- Analyzing temperature records.
- Comparing surface heating.
- Investigating sea-level models.
- Mapping schoolyard temperatures.
- Evaluating evidence about local environmental challenges.
Students can begin identifying variables, discussing limitations, and supporting claims with quantitative evidence.
High School
Emphasize quantitative analysis, uncertainty, scientific models, systems thinking, and competing design constraints.
Suitable activities include:
- Comparing climate datasets from different regions.
- Evaluating evidence from multiple scientific indicators.
- Modeling carbon reservoirs and emissions.
- Examining energy systems and lifecycle emissions.
- Developing data-supported climate adaptation or mitigation proposals.
Older students should be encouraged to examine methodology, distinguish correlation from causation, and assess the quality of scientific sources.
How to Assess Student Understanding of Climate Science
Assessment should measure more than memorization. Students need to demonstrate that they can interpret evidence, apply scientific concepts, and communicate their reasoning.
Use Short Diagnostic Questions
Before a lesson, ask students questions such as:
- What is the difference between weather and climate?
- How can scientists study changes that occur over decades?
- What evidence would help investigate rising sea levels?
Repeat similar questions after the lesson to identify changes in understanding.
Evaluate Data Interpretation
Provide a graph or table and ask students to identify the trend, describe important variations, and explain what conclusions the evidence supports.
Reward accurate interpretation and appropriate caution rather than simply looking for a predetermined phrase.
Assess Scientific Explanations
Ask students to submit a claim supported by observations and scientific reasoning. A strong response should accurately describe the evidence and acknowledge important limitations.
Use Project-Based Assessment
For a climate-resilient school project, assess whether students:
- Identify a clearly defined problem.
- Use relevant evidence.
- Apply accurate scientific concepts.
- Compare alternative solutions.
- Explain practical constraints.
- Communicate their conclusions clearly.
Encourage Reflection
Students can maintain science journals that record their predictions, measurements, unexpected results, and revised explanations. Reflection helps teachers see how students’ reasoning develops throughout an investigation.
Common Challenges When Teaching Climate Science
Challenge 1: Confusing Weather With Climate
Solution: Use long-term datasets alongside daily weather observations. Explain that individual weather events occur within a broader climate system and cannot independently establish a long-term trend.
Challenge 2: Treating a Classroom Model as a Perfect Representation
Solution: Ask students to identify what the model represents, what it leaves out, and how scientists could test its conclusions with additional evidence.
Challenge 3: Using Unreliable Online Information
Solution: Teach students to evaluate scientific sources, check original datasets, identify publication dates, and compare claims with evidence from established scientific organizations.
Challenge 4: Making Climate Lessons Overwhelming
Solution: Focus on clear learning objectives and manageable investigations. Balance explanations of risks with opportunities to explore scientific solutions and practical adaptation measures.
Challenge 5: Assuming One Activity Explains Every Climate Process
Solution: Use several complementary activities. Surface heating, greenhouse gases, ocean warming, carbon cycling, and sea-level change involve related but distinct processes.
Challenge 6: Ignoring Uncertainty and Limitations
Solution: Explain that scientific uncertainty does not mean that all explanations are equally supported. Students should learn to distinguish measurement limitations, natural variability, and uncertainty in particular projections from well-established scientific findings.
Tips for Making Climate Science Lessons More Effective
Teachers can improve classroom learning by following several practical principles.
Connect activities to local experiences. Students may be particularly interested in local heat, rainfall, water availability, agriculture, coastal change, or energy use. Choose examples that fit the school’s location and curriculum.
Use more than one kind of evidence. Combine experiments, scientific datasets, diagrams, and written explanations to help students understand complex systems.
Teach scientific vocabulary in context. Introduce terms such as greenhouse gas, carbon cycle, albedo, mitigation, adaptation, and climate variability when students encounter the related concepts.
Encourage questions rather than rote memorization. Give students time to explain their predictions, compare results, and ask what additional evidence might be needed.
Make scientific reasoning visible. Model how to interpret graphs, evaluate sources, distinguish evidence from opinion, and revise explanations when new information becomes available.
Include different learning formats. Use hands-on investigations, visual models, group discussion, writing, and individual reflection to support students with different learning needs.
Provide constructive, realistic action opportunities. Students can investigate energy use, improve waste practices, design shade projects, or propose water-saving measures. Emphasize that individual actions, community decisions, technological developments, and broader policies can all influence climate responses.
Frequently Asked Questions
What are the best climate science activities for students?
Effective activities include analyzing long-term temperature records, investigating surface heating, modeling the carbon cycle, exploring sea-level rise, studying local runoff, and designing climate-resilient school improvements. The best choice depends on students’ age, learning objectives, available materials, and access to reliable data.
How can teachers explain climate change through experiments?
Teachers can use carefully designed experiments to demonstrate individual processes, such as surface heating, thermal expansion, or differences in runoff. Students should then compare the model with scientific evidence and discuss its limitations. No single classroom experiment reproduces or proves every aspect of climate change.
What is the difference between climate science and weather science?
Weather science examines short-term atmospheric conditions, including temperature, rainfall, wind, and storms. Climate science investigates long-term patterns, variability, and changes in the climate system. Both fields use observations and scientific models, but they often examine different timescales and questions.
How do students use evidence to understand climate change?
Students can analyze temperature records, atmospheric measurements, ocean observations, ice changes, and other scientific indicators. They learn to identify patterns, evaluate data quality, compare independent evidence, and distinguish observations from explanations.
Can climate science activities be completed without a laboratory?
Yes. Many useful activities require only thermometers, containers, water, paper, rulers, or access to public scientific datasets. Weather journals, schoolyard temperature surveys, graph analysis, carbon-cycle games, and climate-resilience design projects can all be completed with basic classroom resources.
How can climate science be taught without frightening students?
Use age-appropriate language, accurate evidence, and balanced explanations. Give students opportunities to understand the science, ask questions, explore practical responses, and work collaboratively on constructive projects. Avoid exaggerating risks or suggesting that students alone are responsible for solving global climate challenges.
How can teachers assess climate science learning?
Teachers can use diagnostic questions, data interpretation exercises, science journals, short explanations, presentations, and project rubrics. Assess whether students understand scientific concepts and can support their conclusions with relevant evidence.
Where can teachers find reliable climate science teaching materials?
Teachers can look for reviewed educational resources from scientific agencies, universities, and recognized science education organizations. NASA and NOAA offer classroom investigations, climate datasets, lesson plans, and educator materials. Teachers should check that each resource fits the students’ age, curriculum, and learning objectives.
Conclusion
Teaching climate science through evidence-based activities helps students move beyond memorizing definitions toward understanding how scientists investigate Earth’s changing systems. Experiments with surface heating, investigations of melting ice, carbon-cycle models, long-term temperature analysis, and local environmental projects can make complex concepts more accessible.
The most effective climate science activities for students combine observation, reliable evidence, scientific reasoning, and thoughtful discussion. Students should learn not only what scientific evidence indicates but also how scientists evaluate that evidence, communicate uncertainty, and develop explanations.
By adapting activities to different grade levels and connecting them to meaningful questions, teachers can build scientific literacy, data interpretation skills, and informed environmental decision-making. These learning experiences prepare students to evaluate climate information critically and participate constructively in discussions about the future of their communities and the planet.
