
Probability is an important part of mathematics that helps students understand uncertainty, predict possible outcomes, and make decisions using evidence. From predicting the result of a coin toss to estimating the chance of rain, probability appears in many everyday situations. However, students can sometimes find probability difficult when it is introduced only through formulas and textbook questions.
Teachers can make the subject easier to understand by using games, experiments, and practical classroom challenges. These experiences allow students to make predictions, observe outcomes, record results, and compare what they expected with what actually happened.
Well-designed probability activities for school students turn abstract mathematical ideas into hands-on learning experiences. Students can explore concepts such as chance, likelihood, equally likely outcomes, theoretical probability, experimental probability, and fairness while developing critical thinking and data-analysis skills.
This guide presents practical probability games, step-by-step classroom activities, age-appropriate teaching strategies, and assessment ideas that teachers can use to make probability lessons more engaging and meaningful.
Why Teach Probability Through Games and Practical Activities?
Probability is not simply about calculating fractions. Students also need to understand what those numbers represent, how chance behaves, and why experimental results may differ from predictions.
Games and practical investigations give students opportunities to explore these ideas directly.
1. Makes abstract concepts easier to understand
Concepts such as one-half, one-quarter, and one-sixth can seem abstract when students only see them on a worksheet. Tossing a coin, rolling a die, or selecting a coloured counter gives students a concrete example of possible outcomes.
For instance, students can see that a standard six-sided die has six possible outcomes and that each outcome has a theoretical probability of one-sixth when the die is fair.
2. Encourages prediction and reasoning
Before an experiment, students can predict what might happen and explain their reasoning. After the experiment, they compare their predictions with the results.
This encourages students to think beyond guessing. They begin to use evidence, identify patterns, and explain why an outcome may be more or less likely than another.
3. Develops data-handling skills
Practical probability experiments produce data that students can record in tables, display in bar charts, and summarize using fractions or percentages.
For example, a class could toss a coin 100 times and compare the number of heads with the number of tails. Students can then discuss why the results may not be exactly equal, even though both outcomes have the same theoretical probability.
4. Promotes collaboration and mathematical discussion
Probability games give students opportunities to explain their predictions, challenge assumptions, compare results, and justify conclusions.
Teachers can encourage students to ask questions such as:
- What makes this outcome more likely?
- Are all possible outcomes equally likely?
- Could the results change if we repeated the experiment?
- Does our experiment provide enough evidence to support our prediction?
These discussions help students develop mathematical language and communicate their reasoning clearly.
5. Helps identify common misconceptions
Students sometimes believe that a particular outcome becomes more likely simply because it has not happened recently. Others assume that a small experiment must closely match theoretical probability.
Practical activities help teachers identify these misconceptions and guide students toward more accurate explanations.
Research on teaching probability through games suggests that structured game-based experiences can support students’ engagement and understanding. However, the strongest lessons combine playing with explicit explanation, mathematical reasoning, data analysis, and reflection.
Essential Probability Concepts Students Should Understand
Before introducing more complex activities, teachers should establish a clear understanding of the basic vocabulary of probability.
Chance and likelihood
Probability describes how likely an event is to occur. Depending on the situation, an event may be impossible, unlikely, equally likely or unlikely relative to another event, likely, or certain.
For example:
- Rolling a seven on a standard six-sided die is impossible.
- Rolling a number greater than four is possible but less likely than rolling a number from one to four.
- Rolling a number from one to six on a standard six-sided die is certain.
These examples assume a standard die with faces numbered one through six.
Possible outcomes
An outcome is a result that can occur in an experiment.
When tossing a coin, the possible outcomes are heads and tails. When rolling a standard six-sided die, the possible outcomes are 1, 2, 3, 4, 5, and 6.
The complete set of possible outcomes is called the sample space.
Theoretical probability
Theoretical probability is calculated from the possible outcomes of a situation when the relevant outcomes are known and equally likely.
The basic formula is:
Theoretical probability = Number of favourable outcomes ÷ Total number of equally likely outcomes
For example, the probability of rolling a 4 on a fair six-sided die is:
[
P(4)=\frac{1}{6}
]
There is one favourable outcome, rolling a 4, out of six equally likely outcomes.
Experimental probability
Experimental probability is calculated using the results of an actual experiment.
Experimental probability = Number of times the event occurs ÷ Total number of trials
If a student rolls a die 30 times and gets a 4 on five occasions, the experimental probability of rolling a 4 in that experiment is:
[
\frac{5}{30}=\frac{1}{6}
]
The experimental probability happens to equal the theoretical probability in this example. In other experiments, the results may differ.
Fair and unfair games
A game is fair in a mathematical sense when the rules and probabilities give the players equal expected chances or otherwise meet the stated fairness condition. Simply giving every player the same number of turns does not always make a game fair.
Students can investigate fairness by identifying possible outcomes, calculating their probabilities, and considering how the rules affect each player’s chances.
12 Practical Probability Activities for School Students
The following activities use accessible materials and can be adapted for different age groups. Teachers should select the activities that best match their students’ prior knowledge and learning objectives.
1. The Coin-Toss Experiment
Best for: Grades 2–8
Concepts covered: Possible outcomes, theoretical probability, experimental probability, and data collection.
Materials:
- One coin per pair or group
- Paper or a recording sheet
- Pencil
- Calculator, if appropriate
How to conduct the activity:
- Ask students to predict whether heads or tails will appear more often.
- Have each student toss a coin 20 times.
- Record every result in a tally chart.
- Count the number of heads and tails.
- Calculate the experimental probability of each outcome.
- Compare the results with the theoretical probability of one-half for each side of a fair coin.
Students may discover that their results are not exactly 50% heads and 50% tails. This provides an opportunity to discuss random variation.
Repeat the experiment with more tosses or combine the class data to investigate how larger samples can provide a different picture.
Discussion questions:
- Were the numbers of heads and tails equal?
- Why might your results differ from your prediction?
- What do you think would happen if the class completed many more tosses?
- Does getting heads several times in a row guarantee that tails will appear next?
Emphasize that previous independent tosses do not make the opposite outcome automatically more likely on the next toss.
2. Rolling a Dice and Recording Results
Best for: Grades 3–9
Concepts covered: Sample space, equally likely outcomes, fractions, frequency, and probability comparison.
Materials:
- Standard six-sided dice
- Recording sheets
- Pencils
- Optional graph paper
How to conduct the activity:
- Give each group one fair six-sided die.
- Ask students to predict how often each number might appear in 60 rolls.
- Roll the die and record every result.
- Create a frequency table showing the number of times each face appears.
- Calculate the experimental probability of each number.
- Compare the results with the theoretical probability of one-sixth.
Students can display their data in a bar chart and compare the results between groups.
Ask students whether one number appearing more frequently means the die is necessarily unfair. Discuss the importance of sample size, random variation, and repeated testing before drawing conclusions.
Extension: Ask students to investigate the probability of rolling an even number or a number greater than four. This moves the activity from individual outcomes to events containing several possible outcomes.
3. The Coloured Counter Bag
Best for: Grades 1–7
Concepts covered: Likelihood, fractions, ratios, sample space, and experimental probability.
Materials:
- An opaque bag
- Coloured counters or cubes
- A recording sheet
Preparation:
Place a known number of counters in the bag. For example, use five red counters, three blue counters, and two yellow counters.
There are ten counters altogether.
How to conduct the activity:
- Ask students to predict which colour is most likely to be selected.
- Calculate the theoretical probability of selecting each colour.
- Draw one counter without looking.
- Record its colour and return it to the bag.
- Repeat the process 30 times.
- Compare the experimental results with the theoretical probabilities.
For the example bag:
- Red: (5/10=1/2)
- Blue: (3/10)
- Yellow: (2/10=1/5)
Red is the most likely colour, but it is not guaranteed to be selected on any particular draw.
Returning the counter after each draw keeps the contents of the bag unchanged and makes the trials comparable.
Extension: Change the number of counters in the bag and ask students to design a bag that gives a particular colour a probability of one-quarter.
4. Design a Fair Spinner
Best for: Grades 3–8
Concepts covered: Probability, fractions, proportions, and fairness.
Materials:
- Paper or card
- Rulers
- Pencils
- Coloured markers
- Paper clips and pencils, or a spinner divided into equal sections
How to conduct the activity:
- Ask students to design a spinner with different coloured sections.
- Have them predict the probability of landing on each colour.
- Ask students to calculate the probability based on the area or number of equal sections assigned to each colour.
- Let students spin the spinner 30 or more times.
- Record and compare the experimental results with their calculations.
- Ask students to modify the spinner to meet a new probability requirement.
For example, students might design a spinner with a one-half probability of landing on blue and a one-quarter probability of landing on each of two other colours.
If the spinner has eight equal sections, four should be blue and two should be assigned to each of the other colours.
Challenge: Students can create two spinners with different designs but the same theoretical probability for a particular event. They then test whether the experimental results are similar.
5. The Probability Prediction Game
Best for: Grades 2–6
Concepts covered: Probability language, likelihood, prediction, and reasoning.
Materials:
- Picture cards or situation cards
- A probability scale displayed on the board
Create cards describing everyday events. Examples include:
- The sun will rise tomorrow.
- A standard six-sided die will show a number between one and six.
- A student selected at random from a group will have a particular eye colour.
- A fair coin will land on heads.
- A standard six-sided die will show a seven.
How to conduct the activity:
- Give students an event card.
- Ask them to place it on a scale ranging from impossible to certain.
- Ask students to explain their choices.
- Compare different answers and discuss the assumptions behind them.
- Introduce numerical probabilities when students are ready.
For younger students, focus on everyday language such as “likely” and “unlikely.” Older students can assign fractions or percentages where the information is sufficient.
Teaching tip: Some events cannot be assigned a precise probability from the information provided. Use these examples to discuss what additional information students would need.
6. The Two-Dice Sum Challenge
Best for: Grades 5–10
Concepts covered: Combined outcomes, sample space, theoretical probability, and probability distributions.
Materials:
- Two standard six-sided dice per group
- Recording sheets
- Optional spreadsheet or graph paper
How to conduct the activity:
- Ask students to predict which sum will appear most frequently when two dice are rolled.
- Have them roll both dice 50 times.
- Record the sum of each pair of results.
- Create a frequency table for sums from 2 to 12.
- Display the results in a bar chart.
- Compare the experimental distribution with the theoretical possibilities.
A common misconception is that all sums from 2 to 12 are equally likely. However, the sum of 7 can be produced in six different ways, while the sum of 2 can be produced only by rolling 1 on both dice.
Students can list the 36 equally likely ordered outcomes and count how many produce each sum.
For example:
[
P(\text{sum of }7)=\frac{6}{36}=\frac{1}{6}
]
This activity helps students understand why some combined outcomes are more likely than others.
7. The Mystery Box Probability Challenge
Best for: Grades 3–8
Concepts covered: Inference, probability, experimental evidence, and logical reasoning.
Materials:
- An opaque box or bag
- Coloured objects or counters
- Recording sheets
Place an unknown mixture of coloured counters in the box. Students know the possible colours but do not know the quantities.
How to conduct the activity:
- Explain which colours may be present.
- Let students draw one counter at a time, record its colour, and return it to the box.
- After a set number of draws, ask students to estimate which colours may be more common.
- Have them explain how the results support their estimates.
- Reveal the contents and compare the estimates with the actual quantities.
Students should understand that their sample provides evidence but does not always reveal the exact contents of the box. A small number of draws may produce misleading results.
Extension: Ask students how many additional draws might help them become more confident in their estimate and why.
8. Create a Probability-Based Board Game
Best for: Grades 4–10
Concepts covered: Probability, strategic thinking, fairness, and mathematical communication.
Materials:
- Paper or cardboard
- Dice, spinners, or cards
- Counters
- Pencils and markers
Students design a simple board game in which movement depends on random outcomes.
How to conduct the activity:
- Ask students to design a game for two or more players.
- Define how dice rolls, card draws, or spinner outcomes affect movement.
- Write clear rules.
- Ask students to calculate the probability of key events.
- Let classmates play the game several times.
- Collect feedback and revise the rules if needed.
The main objective is to investigate whether the game behaves as intended.
For example, students may want every player to have a reasonable chance of winning. They must examine whether the rules, starting positions, and random outcomes support that goal.
Ask each group to submit a short explanation of the probabilities that influence its game.
9. The Probability Card-Drawing Game
Best for: Grades 4–9
Concepts covered: Sample space, favourable outcomes, fractions, and probability comparisons.
Materials:
- A set of numbered cards or cards with different colours
- Recording sheets
Prepare a set of cards with a known distribution. For example, use 12 cards: five red, four blue, and three green.
How to conduct the activity:
- Ask students to calculate the probability of drawing each colour.
- Shuffle the cards thoroughly.
- Draw one card and record its colour.
- Return the card and shuffle again.
- Repeat for a set number of trials.
- Compare the observed frequencies with the theoretical probabilities.
Returning the card means the probability distribution remains unchanged for each draw.
Extension: Remove the card after each draw and ask students to explain how the probabilities change. This introduces the difference between sampling with replacement and sampling without replacement.
10. The Weather Probability Investigation
Best for: Grades 5–10
Concepts covered: Data analysis, relative frequency, percentages, and interpretation of probability statements.
Materials:
- A teacher-provided set of historical weather data
- Graph paper or a spreadsheet
- Calculators
Give students a suitable dataset showing weather conditions over a period of time.
How to conduct the activity:
- Ask students to identify the weather categories in the dataset.
- Count how often each category occurs.
- Calculate the relative frequency of each category.
- Convert selected fractions into percentages.
- Display the results in a graph.
- Discuss what the historical data can and cannot tell us about future weather.
Students should understand that historical frequency is not automatically the same as a reliable forecast for a particular day. Weather probabilities depend on additional information and forecasting methods.
Extension: Compare datasets from different seasons and discuss how the observed frequencies change.
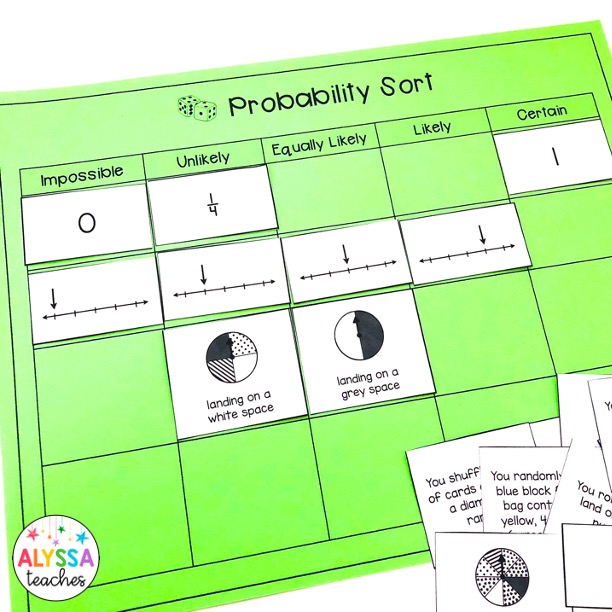
11. The Probability Sorting Activity
Best for: Grades 1–5
Concepts covered: Classification, likelihood, probability language, and basic reasoning.
Materials:
- Event cards
- Three or five labelled sorting areas
Prepare cards describing events that students can classify by likelihood.
Examples include:
- Selecting a red counter from a bag containing only red counters.
- Rolling a number greater than six on a standard six-sided die.
- Tossing a fair coin and getting tails.
- Selecting a blue counter from a bag containing mostly blue counters and a few red counters.
How to conduct the activity:
- Explain the categories, such as impossible, unlikely, equally likely, likely, and certain.
- Ask students to place each card in the appropriate category.
- Invite them to explain their reasoning.
- Discuss cases where additional information is required.
- Ask students to create their own event cards.
This activity introduces probability language before students are expected to use more complex calculations.
12. The Probability Simulation Challenge
Best for: Grades 6–12
Concepts covered: Repeated trials, experimental probability, theoretical probability, variation, and simulation.
Materials:
- Coins, dice, or counters
- A computer or spreadsheet, if available
- Recording sheets
Students investigate an experiment by repeating it many times. They can use physical materials or a simple digital simulation.
How to conduct the activity:
- Define an experiment and identify its possible outcomes.
- Calculate the theoretical probability where appropriate.
- Complete a small number of trials and record the results.
- Repeat the experiment with a larger number of trials.
- Compare the experimental probabilities.
- Discuss the variation between the results and the theoretical expectation.
For example, students can simulate 20, 100, and 500 coin tosses and compare the proportion of heads in each sample.
The results will not necessarily become closer to one-half after every additional toss. Instead, as the number of independent trials grows, the observed proportion generally tends to stabilize around the theoretical probability.
A simulation also allows students to investigate situations that would be time-consuming to reproduce manually.
A Simple Comparison of Probability Activities
Teachers can use the following table to select activities according to the concepts they want students to practise.
| Activity | Main concept | Materials | Suggested level |
|---|---|---|---|
| Coin-toss experiment | Experimental probability | Coins | Grades 2–8 |
| Dice experiment | Sample space and frequency | Dice | Grades 3–9 |
| Coloured counter bag | Fractions and likelihood | Bag and counters | Grades 1–7 |
| Fair spinner | Proportions and fairness | Spinner materials | Grades 3–8 |
| Prediction game | Probability language | Event cards | Grades 2–6 |
| Two-dice sum challenge | Combined outcomes | Two dice | Grades 5–10 |
| Mystery box | Inference and evidence | Opaque box and counters | Grades 3–8 |
| Board game design | Fairness and strategy | Cardboard and randomizers | Grades 4–10 |
| Card-drawing game | Favourable outcomes | Numbered or coloured cards | Grades 4–9 |
| Weather investigation | Relative frequency | Weather dataset | Grades 5–10 |
| Probability sorting | Classification and likelihood | Event cards | Grades 1–5 |
| Simulation challenge | Repeated trials and variation | Dice, coins, or software | Grades 6–12 |
These grade ranges are suggestions, not strict limits. Teachers should adjust the calculations, instructions, and amount of support to match students’ prior learning.
How to Teach Probability Effectively Through Games
Games are most useful when they are directly connected to clear learning objectives. Simply allowing students to play a game does not guarantee that they will understand the mathematical ideas behind it.
Start with predictions
Ask students to predict what might happen before they begin. Encourage them to explain why they think an outcome is likely or unlikely.
Recording the prediction gives students something concrete to compare with their results later.
Encourage students to explain their reasoning
Ask students to describe how they reached a conclusion. If a student believes one outcome is more likely, ask them to identify the possible outcomes and explain how many favour the event.
This helps teachers distinguish between accurate reasoning and a correct answer based on guessing.
Use tables and graphs
Data displays make patterns easier to discuss. Students can record outcomes in tally charts, create frequency tables, and compare experimental results using bar charts or percentages.
Older students can explore relative frequency and variation across repeated trials.
Compare theoretical and experimental probability
Help students connect the mathematical prediction with the results of a real experiment.
For a fair coin, the theoretical probability of heads is one-half. However, a small set of tosses may produce a proportion of heads that differs substantially from one-half.
Students should learn that this variation does not automatically mean the coin is unfair.
Discuss misconceptions directly
Probability can conflict with students’ everyday intuitions. For example, after several heads in a row, a student may assume tails must appear on the next toss.
Use practical experiments to explain that independent tosses of a fair coin have the same probability of heads and tails each time.
Another common misconception is that every outcome in a combined experiment is equally likely. The two-dice sum challenge helps students see why different sums can have different probabilities.
Finish with reflection
After each activity, ask students what they learned and how the evidence supports their conclusions.
A short reflection can include:
- What did you predict?
- What happened during the experiment?
- How did your results compare with the theoretical probability?
- What surprised you?
- What would you change if you repeated the experiment?
Reflection helps students connect the enjoyable part of the game with the underlying mathematics.
Adapting Probability Activities to Different Grade Levels
Probability lessons should build gradually from intuitive understanding toward more formal calculations.
Early elementary students
Focus on everyday situations and simple language. Students can sort events by likelihood, predict the result of a coin toss, and explore bags containing coloured objects.
Use visual materials, short activities, and opportunities to explain ideas orally.
Upper elementary students
Introduce fractions, sample spaces, tally charts, and simple experimental probability. Ask students to record outcomes and compare their predictions with the observed results.
At this stage, students can begin explaining why a fair die has six equally likely outcomes.
Middle school students
Develop theoretical probability, relative frequency, combined outcomes, and the relationship between predictions and data. Students can design spinners, test whether games are fair, and compare experimental results across groups.
Encourage students to explain the mathematical reasoning behind their conclusions.
High school students
Introduce more complex probability models, independent and dependent events, conditional probability where appropriate, simulations, and probability distributions.
Students can investigate how assumptions influence a model and compare calculated probabilities with simulated or observed results.
How to Assess Students’ Understanding of Probability
Teachers should assess more than whether students can apply a formula. A student may calculate a probability correctly without understanding what it represents.
Use several forms of evidence to develop a clearer picture of learning.
Check conceptual understanding
Ask students to explain the meaning of a probability such as one-quarter or 70%. They should be able to connect the number with the likelihood of an event under the stated conditions.
Review students’ data tables
Check whether students record outcomes accurately, count frequencies correctly, and use the right total number of trials when calculating experimental probability.
Ask students to justify their answers
Questions such as “Why is this event more likely?” or “How do you know this game is fair?” require students to explain their reasoning.
Compare predictions with results
Ask students to discuss the difference between theoretical and experimental probability. They should recognize that short experiments may produce unusual results and that probability describes uncertainty rather than guaranteeing a specific outcome.
Use exit tickets
At the end of a lesson, ask students to answer a short question or explain one idea they learned.
For example:
“A bag contains four red counters and six blue counters. What is the theoretical probability of drawing a red counter? Explain your answer.”
The expected probability is four out of ten, or two-fifths, assuming a counter is selected at random.
Common Mistakes to Avoid When Teaching Probability
Focusing only on formulas
Students may memorize probability formulas without understanding the possible outcomes. Use concrete materials and visual representations before introducing more complex calculations.
Treating experimental results as guaranteed predictions
A small experiment does not establish exactly what will happen in the next trial. Teach students to distinguish between a theoretical probability, an observed frequency, and a guarantee.
Assuming every outcome is equally likely
Some experiments have equally likely outcomes, but others do not. Students need to examine the structure of the experiment before applying a formula that assumes equal likelihood.
Ignoring students’ explanations
Correct calculations are useful, but students should also explain why their answers make sense. Discussion can reveal misconceptions that a numerical answer alone may hide.
Making every game competitive
Competition can motivate some students, but it may distract others from the learning objective. Cooperative investigations and shared data collection can make probability accessible to a wider range of learners.
Using activities without a clear learning objective
Every activity should have a mathematical purpose. Decide whether students are exploring likelihood, calculating theoretical probability, comparing experimental results, or investigating fairness before selecting the game.
Frequently Asked Questions
1. What are the best probability activities for school students?
Effective activities include coin tossing, dice experiments, coloured counter bags, spinner design, probability card games, two-dice investigations, and simulations. The best choice depends on students’ ages, prior knowledge, and learning objectives.
2. How do games help students learn probability?
Games give students opportunities to predict outcomes, conduct experiments, collect data, and compare results with theoretical calculations. When teachers include discussion and reflection, games can help students connect mathematical ideas with observable experiences.
3. What is the difference between theoretical and experimental probability?
Theoretical probability is calculated from the possible outcomes of a situation under specified assumptions. Experimental probability is calculated from the outcomes observed during an actual experiment. The two may differ, especially when the number of trials is small.
4. How can teachers explain probability to young students?
Teachers can begin with familiar situations, such as tossing a coin, selecting a coloured counter, or predicting the result of a simple game. Using words such as impossible, unlikely, likely, and certain helps students develop an intuitive understanding before working with fractions.
5. Can probability be taught without computers?
Yes. Many effective activities use coins, dice, cards, counters, paper, and simple spinners. Digital simulations are useful when a large number of trials or a more complex experiment would be difficult to conduct manually, but they are not required for introductory lessons.
6. How can teachers explain why experimental probability differs from theoretical probability?
Students can compare predictions with results from repeated experiments. Random variation means that small samples may differ from theoretical expectations. Larger samples often provide more stable estimates, although individual outcomes remain uncertain.
7. What is a fair probability game?
A fair game is one in which the rules give players the intended equal chances or meet the stated mathematical fairness condition. Students can test fairness by identifying possible outcomes, calculating probabilities, and examining how the rules affect the results.
8. How can probability activities support critical thinking?
Students must make predictions, identify assumptions, analyze data, compare evidence, and justify conclusions. These processes encourage them to question unsupported beliefs and explain their decisions using mathematical reasoning.
Conclusion
Teaching probability through games and practical activities helps students connect mathematical concepts with real experiences. Coin tosses, dice experiments, coloured counters, spinner challenges, card games, and simulations provide opportunities to explore chance, calculate probabilities, collect data, and investigate fairness.
The most effective probability activities for school students combine hands-on participation with clear explanations and meaningful reflection. Teachers should encourage students to predict outcomes, record evidence, compare theoretical and experimental probability, and explain what their findings mean.
By making probability a process of investigation rather than a collection of formulas, educators can help students develop stronger mathematical reasoning and a more confident understanding of uncertainty. These skills support classroom learning and help students interpret chance and evidence in everyday life.
Additional Classroom Planning Tips
Before introducing a probability activity, teachers should check the materials, identify the main mathematical concept, and prepare questions that encourage reasoning. Students should understand the rules and have enough time to record their results and discuss what they learned.
After the activity, review any misconceptions and provide a short follow-up problem that asks students to apply the concept in a new context. This helps ensure that the learning extends beyond the game itself.
