
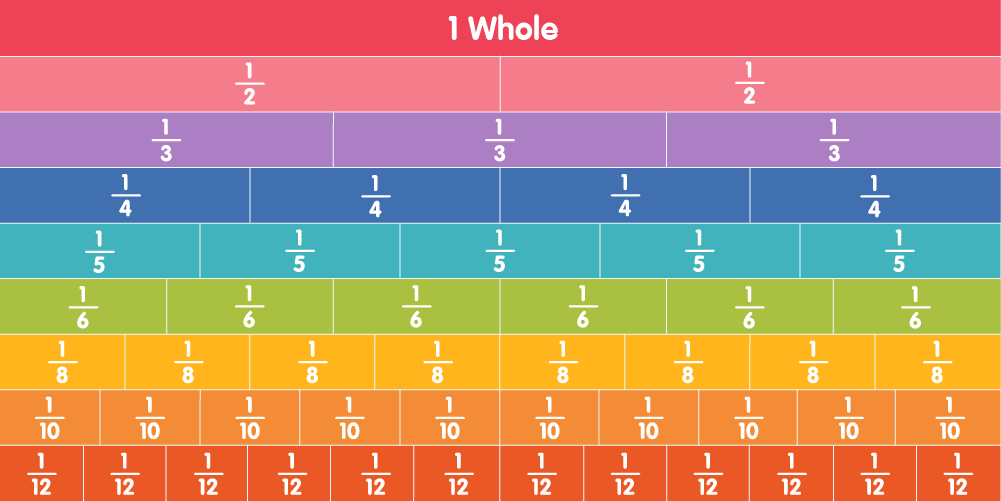
Fractions are an important part of elementary mathematics, but many students find them difficult to understand. Learners may memorize rules for adding, subtracting, or comparing fractions without fully understanding what the numbers represent. Visual models can make these concepts easier to understand by turning abstract mathematical ideas into pictures, diagrams, and measurable quantities.
Teaching fractions with visual models helps students recognize equal parts, compare quantities, understand equivalent fractions, and develop stronger mathematical reasoning. Instead of relying entirely on memorized procedures, students can see how fractions work and explain why their answers make sense.
Teachers can use fraction bars, number lines, area models, fraction circles, and real-life objects to introduce concepts gradually. These strategies are suitable for elementary classrooms and can be adapted for students who need additional support or more challenging mathematical tasks.
This guide explains practical strategies for teaching fractions with visual models, provides classroom activities, and shows how teachers can assess student understanding effectively.
Why Are Visual Models Important for Teaching Fractions?
Fractions represent numbers and relationships that students cannot always understand through symbols alone. A fraction such as 3/4 represents three equal parts out of four equal parts of a whole. Students need to understand both the size of the parts and the number of parts being considered.
Visual models make these relationships visible. For example, when students shade three out of four equal sections of a rectangle, they can connect the fraction 3/4 with a specific quantity.
Visual representations can help students:
- Understand the meaning of numerators and denominators.
- Recognize that fractions represent numbers, not just two separate whole numbers.
- Compare fractions using their relative sizes.
- Identify equivalent fractions.
- Add and subtract fractions by considering the sizes of the parts.
- Connect fractions with decimals, percentages, measurement, and everyday situations.
- Explain their mathematical reasoning with greater confidence.
Research on fraction instruction supports the use of multiple representations, particularly number lines and unit fractions, to strengthen conceptual understanding. Students benefit when teachers explicitly connect visual representations to mathematical language and symbolic notation.
Understanding the Main Types of Fraction Visual Models
Different visual models highlight different aspects of fractions. Teachers should select models according to the learning objective rather than relying on a single representation for every concept.
1. Area Models
Area models show fractions by dividing a shape into equal-sized regions. Common examples include rectangles, squares, and circles.
For example, to represent 3/4, divide a rectangle into four equal sections and shade three of them.
The shaded area represents the numerator, while the total number of equal sections represents the denominator.
Area models are useful for introducing fractions, exploring equivalent fractions, and illustrating multiplication of fractions.
Teachers must ensure that the sections are equal in size. If a shape is divided into four unequal pieces, simply shading three pieces does not necessarily represent 3/4.
2. Fraction Bars
Fraction bars are rectangular strips divided into equal parts. They make it easy to compare fractions and see how different fractions can represent the same amount.
For example, a bar divided into two equal sections can show 1/2, while another bar divided into four equal sections can show 2/4. When the bars have the same total length, students can see that 1/2 and 2/4 represent equal quantities.
Fraction bars are especially useful for comparing fractions, finding equivalent fractions, and adding or subtracting fractions with related denominators.
3. Number Lines
A number line represents fractions as positions between whole numbers.
To show 3/4, divide the distance from 0 to 1 into four equal intervals and mark the third interval.
Number lines help students understand that fractions are numbers with measurable values. They are particularly valuable for comparing fractions, ordering fractions, estimating quantities, and understanding improper fractions.
Unlike an area model, a number line emphasizes the magnitude and position of a fraction. Research has found that number-line instruction can support students’ fraction magnitude understanding, making it an important representation to include alongside area and bar models.
4. Fraction Circles
Fraction circles use circular shapes divided into equal sectors. They resemble familiar objects such as pies and pizzas, making them useful for introducing equal sharing.
For example, a circle divided into eight equal sectors can show 5/8 when five sectors are shaded.
Fraction circles help students explore parts of a whole and compare simple fractions. However, teachers should also use rectangles and number lines so students understand that fractions apply beyond circular objects.
5. Set Models
Set models represent fractions as part of a collection of objects.
For example, if a group contains 12 counters and 3 are red, the fraction of red counters is 3/12, which simplifies to 1/4.
Set models help students understand fractions as part of a group rather than only as shaded portions of a single shape.
They are useful for connecting fractions to real-life situations involving classroom objects, toys, fruit, and collections.
10 Practical Strategies for Teaching Fractions With Visual Models
The following strategies help teachers introduce fraction concepts through clear, hands-on, and visually supported learning experiences.
1. Begin With Real Objects and Equal Sharing
Students often understand fractions more easily when they begin with familiar objects.
Materials: Paper strips, counters, playdough, or paper circles.
How to teach it:
- Give students a paper strip or circle representing one whole.
- Ask them to divide it into two equal parts.
- Discuss how each part represents one-half.
- Repeat the activity with four and eight equal parts.
- Ask students to explain how the number of parts changes the size of each part.
For example, one-half is larger than one-fourth when both fractions refer to the same-sized whole.
This activity introduces the idea that the denominator tells how many equal parts make up the whole, while the numerator tells how many of those parts are being considered.
Teaching tip: Emphasize equal-sized parts. Equal sharing is a foundational concept that supports later work with equivalent fractions and fraction operations.
2. Use Fraction Bars to Compare Fractions
Fraction bars allow students to compare quantities without immediately relying on formal rules.
Materials: Paper strips, rulers, pencils, and colored markers.
How to teach it:
- Prepare strips of equal length.
- Divide one strip into two equal parts, another into four, and another into eight.
- Shade one or more sections on each strip.
- Place the strips together and compare the shaded lengths.
- Ask students to describe which fraction is larger and explain why.
For example, students can compare 1/2, 2/4, and 4/8 using equal-length strips. The matching shaded lengths show that all three fractions represent the same quantity.
This strategy helps students discover equivalent fractions visually rather than memorizing multiplication rules before understanding their meaning.
Extension: Ask students to find two different fractions that represent the same amount and explain how they know.
3. Introduce Fractions on a Number Line
Number lines help students connect fractions to the broader number system.
Materials: A ruler, paper, pencils, and a number line worksheet.
How to teach it:
- Draw a line with 0 at the beginning and 1 at the end.
- Divide the interval into two equal sections.
- Mark the midpoint as 1/2.
- Repeat using four equal intervals to locate 1/4, 2/4, and 3/4.
- Ask students to compare the locations of the fractions.
Students can see that 3/4 lies to the right of 1/2 because it represents a greater value.
Next, extend the number line beyond 1 to introduce improper fractions such as 5/4. Students can discover that fractions may represent values greater than one whole.
Teaching tip: Make sure students divide the distance between the endpoints into equal intervals. Uneven intervals can create confusion about fraction size.
4. Teach Equivalent Fractions With Overlapping Models
Equivalent fractions represent the same quantity even when their numerators and denominators differ.
Materials: Fraction bars or rectangular grids.
How to teach it:
- Draw a rectangle and divide it into two equal parts.
- Shade one part to represent 1/2.
- Draw an equally sized rectangle and divide it into four equal parts.
- Shade two parts to represent 2/4.
- Compare the shaded areas and discuss why they are equal.
Repeat the process with 3/6 and 4/8.
Students should recognize that multiplying the numerator and denominator by the same nonzero number creates an equivalent fraction because the relative quantity remains unchanged.
For example:
[
\frac{1}{2}=\frac{2}{4}=\frac{4}{8}
]
Visual models help students understand why this relationship works before applying the formal procedure independently.
5. Use Area Models to Teach Fraction Addition
Area models can make fraction addition more understandable by showing how quantities combine.
Example: (1/4 + 2/4)
How to teach it:
- Draw a rectangle divided into four equal sections.
- Shade one section to represent 1/4.
- Shade two additional sections to represent 2/4.
- Count the three shaded sections.
- Write the result as 3/4.
The model shows that when the denominators are the same, the parts have equal sizes and can be combined directly.
For fractions with different denominators, teachers can first use models to show why the parts must be expressed in compatible sizes.
For example, when adding 1/2 and 1/4, divide the whole into four equal sections. One-half becomes 2/4, so adding 1/4 gives 3/4.
[
\frac{1}{2}+\frac{1}{4}
=\frac{2}{4}+\frac{1}{4}
=\frac{3}{4}
]
Teaching tip: Explain that denominators describe the size of the fractional parts, not quantities that can simply be added together.
6. Demonstrate Fraction Subtraction With Visual Models
Fraction subtraction becomes clearer when students can see what is being removed from a quantity.
Example: (3/4 – 1/4)
How to teach it:
- Draw a rectangle divided into four equal sections.
- Shade three sections to represent 3/4.
- Cross out one shaded section to represent removing 1/4.
- Count the remaining shaded sections.
- Record the answer as 2/4, which simplifies to 1/2.
This model demonstrates that subtraction means removing or finding the difference between quantities.
For more challenging problems, use fraction bars or number lines to illustrate subtraction with different denominators.
For example, students can represent 5/6 and 1/3 on a number line or with compatible bars to determine the distance between them.
Encourage students to explain their answers using both the visual representation and the mathematical expression.
7. Connect Fractions to Everyday Situations
Real-life contexts help students recognize why fractions matter.
Examples include:
- Sharing a sandwich equally among four students.
- Measuring ingredients for a recipe.
- Dividing a classroom art project into equal sections.
- Measuring distances during a sports activity.
- Representing the portion of a collection that belongs to a particular category.
Classroom activity: Present a scenario in which three students share two identical sandwiches equally. Ask students to draw a model showing how much each student receives.
Students can use rectangles, circles, or fraction bars to represent the sharing process and explain the result.
This approach encourages mathematical reasoning and helps learners connect visual models with practical problem-solving.
Teaching tip: Ask students to create their own fraction word problems based on familiar experiences. This encourages them to apply mathematical ideas independently.
8. Use Hundred Grids to Connect Fractions, Decimals, and Percentages
A hundred grid contains 100 equal squares, making it useful for showing fractions with a denominator of 100.
Materials: A 10-by-10 grid and colored pencils.
How to teach it:
- Give students a grid containing 100 equal squares.
- Ask them to shade 25 squares.
- Write the shaded fraction as 25/100.
- Express the fraction as the decimal 0.25 and the percentage 25%.
- Repeat with other quantities, such as 50, 75, and 40 squares.
Students can see that different mathematical notations can represent the same quantity.
For example:
[
\frac{25}{100}=0.25=25%
]
This visual strategy supports later learning about decimal place value, percentages, proportions, and data interpretation.
Extension: Ask students to represent 3/4 on a hundred grid and determine how many squares must be shaded.
9. Teach Fraction Multiplication With Area Models
Area models can help students understand fraction multiplication as finding a portion of another portion.
Example: (1/2 \times 1/3)
How to teach it:
- Draw a rectangle representing one whole.
- Divide it into two equal columns and shade one column to represent 1/2.
- Divide the same rectangle into three equal rows in a different direction.
- Shade one row using a different color or pattern.
- Identify the overlapping region.
The rectangle contains six equal smaller sections, and the overlapping region is one of them. Therefore, the product is 1/6.
[
\frac{1}{2}\times\frac{1}{3}
=\frac{1}{6}
]
This model demonstrates why multiplying fractions can produce a result smaller than either factor when both factors are positive fractions less than one.
For older students, use rectangular grids to explore more complex products and connect the visual representation with the multiplication algorithm.
10. Use Fraction Model Games for Practice
Games provide opportunities for students to apply fraction concepts while receiving immediate feedback.
Fraction Match
Prepare cards containing fractions, shaded diagrams, and number-line positions. Students match cards that represent the same value.
For example, a card showing 1/2 can be matched with a shaded bar representing 2/4 or a point at the midpoint of a number line.
Fraction Comparison Challenge
Give students two fraction cards and ask them to represent each fraction using a bar model or number line. They then decide which fraction is greater and explain their reasoning.
Build-a-Whole Game
Provide students with fraction pieces or paper strips. Challenge them to combine pieces that make exactly one whole.
Possible combinations include 1/2 + 1/4 + 1/4 or 1/3 + 1/3 + 1/3.
These games reinforce visual reasoning, encourage mathematical discussion, and allow teachers to identify misconceptions during practice.
A Practical Sequence for Teaching Fractions
Teachers can introduce fraction concepts in a gradual sequence that moves from concrete experiences to abstract notation.
Stage 1: Concrete Experiences
Begin with physical objects, paper folding, counters, and equal-sharing activities. Students should understand what a whole is and why equal parts matter.
Stage 2: Visual Representations
Introduce fraction circles, bars, area models, and number lines. Encourage students to draw their own representations and explain what each part means.
Stage 3: Connect Models to Symbols
Teach students to write fractions that match their diagrams. Explain how numerators and denominators relate to the quantities represented.
Stage 4: Compare and Operate
Use models to explore fraction comparison, equivalence, addition, subtraction, and multiplication. Introduce procedures after students have developed an understanding of the underlying relationships.
Stage 5: Apply Fractions Independently
Provide word problems, estimation tasks, and real-world challenges. Ask students to choose an appropriate model and justify their solutions.
This sequence helps learners develop flexible fraction understanding rather than depending on one visual representation or a memorized rule.
Common Misconceptions When Teaching Fractions
Understanding common errors allows teachers to provide targeted support before misunderstandings become persistent.
Misconception 1: A Larger Denominator Always Means a Larger Fraction
Students may think 1/8 is greater than 1/4 because eight is greater than four.
Use fraction bars of equal total length to show that dividing the same whole into more equal parts makes each part smaller.
Misconception 2: Fraction Parts Do Not Need to Be Equal
Students may shade three regions of a shape and label the result 3/4 even when the four regions are unequal.
Ask learners to check whether the whole has been divided into equal parts before naming the fraction.
Misconception 3: The Numerator and Denominator Are Separate Whole Numbers
Some students compare fractions by looking at the numerator and denominator independently.
Use number lines and fraction bars to emphasize the size of the complete fraction rather than treating the two numbers as unrelated quantities.
Misconception 4: Different Visual Models Show Different Mathematical Values
A student may understand 1/2 on a circle but fail to recognize the same value on a rectangle or number line.
Provide practice with multiple representations and ask students to explain how the models express the same quantity.
Misconception 5: Adding Fractions Means Adding Both Numerators and Denominators
Students sometimes calculate 1/4 + 1/4 as 2/8.
Use fraction bars to show that two one-fourth pieces combine to make two-fourths, or one-half. Explain that the parts retain their size when fractions with the same denominator are added.
How to Assess Student Understanding of Fractions
Teachers should assess whether students understand the meaning of fractions, not only whether they can perform calculations correctly.
Useful assessment strategies include:
Visual representation tasks: Ask students to draw or select a model for a given fraction.
Explanation questions: Ask learners why 2/4 and 1/2 represent the same quantity.
Comparison activities: Present two fractions and ask students to justify which is larger using a number line or fraction bar.
Error analysis: Show a diagram or calculation containing a mistake and ask students to explain what went wrong.
Exit tickets: End the lesson with a short question, such as representing 3/5 on a number line or explaining why 1/3 is smaller than 1/2.
Teachers can use these responses to decide whether students are ready for more advanced concepts or need additional practice with foundational ideas.
Adapting Visual Fraction Instruction for Different Learners
Students learn at different rates and may find certain representations easier to understand than others. Flexible teaching allows learners to access the same mathematical concept through different approaches.
For Students Who Need Additional Support
Use fewer fractions at a time, provide pre-divided shapes, and demonstrate how to identify equal parts. Repeat important concepts with different materials and give students time to explain their reasoning.
For Visual and Hands-On Learners
Provide colored fraction bars, paper-folding tasks, number-line activities, and opportunities to construct their own models.
For Students Ready for More Challenge
Introduce improper fractions, mixed numbers, fraction multiplication, and more complex comparisons. Ask students to represent the same problem using two different models and explain the advantages of each.
For Inclusive Classrooms
Use clear visual instructions, high-contrast diagrams, verbal explanations, and physical materials where appropriate. Avoid relying on color alone to distinguish fraction parts; patterns, labels, or symbols can provide additional support.
The goal is not to make every student use the same model. It is to help every learner develop accurate, connected understanding of fraction quantities.
Frequently Asked Questions
What are the best visual models for teaching fractions?
Fraction bars, area models, fraction circles, number lines, and set models are all useful. Fraction bars and area models help students understand equal parts and equivalent fractions, while number lines are particularly helpful for understanding fraction magnitude and comparing values.
Why are visual models effective for teaching fractions?
Visual models make abstract relationships visible. Students can see how a whole is divided, how fractional parts compare, and why different fractions may represent the same quantity. Models also help teachers identify misconceptions and encourage students to explain their reasoning.
How can teachers teach equivalent fractions visually?
Teachers can place fraction bars of equal length beside each other or shade equal proportions of identical shapes. For example, shading one-half of a rectangle and two-fourths of an identical rectangle demonstrates that 1/2 and 2/4 represent the same quantity.
How can number lines help students understand fractions?
Number lines show fractions as positions between whole numbers. Students can use them to order fractions, compare magnitudes, estimate values, and understand fractions greater than one. They also reinforce the idea that fractions are numbers, not merely parts of a shape.
At what grade level should teachers introduce visual fraction models?
Teachers can introduce simple equal-sharing and fraction-circle activities in the early elementary years. More formal work with fraction bars, number lines, equivalent fractions, and operations can develop as students gain confidence with foundational concepts.
Can visual models help students who struggle with mathematics?
Yes. Visual models offer another way to understand quantities and relationships, especially when symbolic procedures are confusing. Teachers should combine diagrams with explicit instruction, guided practice, mathematical language, and gradual movement toward independent problem-solving.
Should teachers use visual models before teaching fraction rules?
In most cases, beginning with concrete and visual representations helps students understand why mathematical procedures work. Teachers can then connect these representations to formal rules and gradually reduce support as students develop confidence.
Conclusion
Teaching fractions with visual models helps students move beyond memorizing rules toward understanding the quantities and relationships represented by fractions. Fraction bars, area models, number lines, circles, and set models give learners practical ways to explore equal parts, compare values, identify equivalent fractions, and solve fraction problems.
The most effective approach combines different representations with clear explanations, hands-on activities, guided practice, and opportunities for students to explain their reasoning. Teachers should also watch for common misconceptions and use assessment to identify which concepts need further attention.
By making fractions visible and connecting diagrams with mathematical notation, educators can help students develop stronger number sense, greater confidence, and a more lasting understanding of mathematics.
